The Water Reuse System Database
Database last updated: January 15, 2023
This national database was started by the Columbia University Water Center in partnership with Hazen and Sawyer and The WateReuse Association as part of The Water Research Foundation Project # 5040, Successful Implementation of Onsite and Distributed Water Reuse Systems. The original database includes information on over 300 onsite and distributed water reuse systems in a standardized format. Efforts were made to include diversity in sources, end uses, and locations. All data is accessible via the dashboard.
We plan to periodically update the database with new information. You can submit additional information for inclusion in future updates here.
Accessing the Information
The database is accessible via a 2-section dashboard. The top section of the dashboard is referred to as the "Browser" section and the window below that is referred to as the "System Profile" section.
Dashboard User Guide
System Profile Search Tool Layout
Overview
The dashboard has two parts, each of which allows you to explore the database in different ways:
Browser
The Browser allows users to filter the database to get a list and map of specific types of systems. Keep in mind that systems with missing information in a field will automatically be removed from the list when a filter is applied to that field.
Filter Options
Included Fields
There are two groups of information:
- Key Facts
- Details
The Key Fact fields are shown both the Browser part of the dashboard and the System Profile part of the dashboard. The Details fields are only available in the System Profile part of the Dashboard
Key Facts (Standardized Across Systems)
Detailed Information
Browser Layout
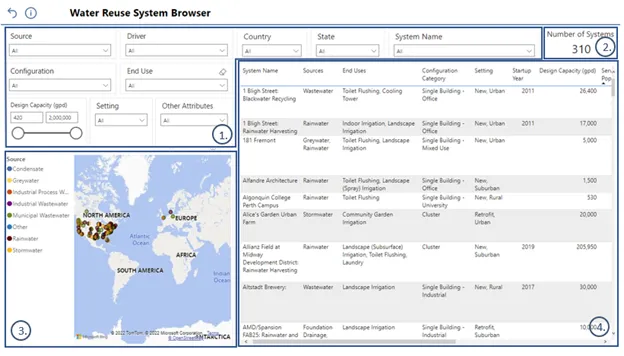
- Section 1 is where users can set filters to search the database. Filter may be set for Water Source, System Driver, System Configuration, End Use, Design Capacity (gpd), Setting, Other Attributes, Country, State, and System Name. Click on the return arrow button at the top of the page to reset filters.
- Section 2 shows the number of systems that meet selected search criteria. No filters were applied in Figure 5‑1, so the search returned all 310 systems in the database.
- Section 3 maps the locations of each system in the search results. Hovering over a point on the map allows you to see the system name. The color of the point indicates the water source. For systems with more than one water source, the data point is split between the respective colors. The map can be zoomed in/out and moved, as needed.
- Section 4 is an exportable table of summary characteristics for systems that met the selected search criteria. This table only displays a few important fields – all fields can be viewed on the System Profile page. Cells for which information is missing have been intentionally left blank.
System Profile Search Tool
This part of the dashboard is useful for viewing all available information for specific systems. Users can see all the standardized fields that show up in the browser, as well as more detailed non-standardized information (i.e., paragraphs) extracted from the listed references.
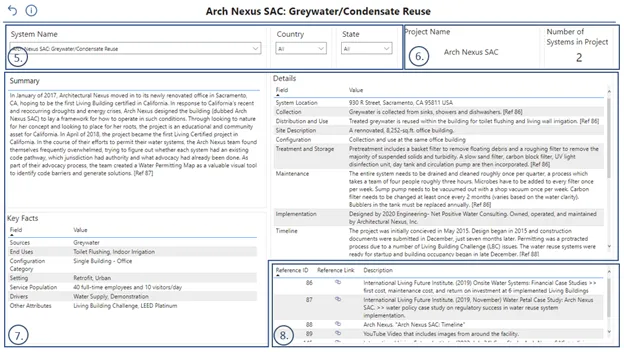
- Section 5 allows the user to search the database by System Name, Country, or State. Once selected, the system name is displayed at the top of the page. Click on the return arrow button at the top of the page to reset filters.
- Section 6 displays the project name associated with the selected system. Since a single project may have multiple systems associated with it, the number to the right of the Project Name displays the total number of systems associated with the project. The system selected in Figure 5‑2 is only one of two systems associated with the Arch Nexus SAC project.
- Section 7 presents all available information for the selected system in three field groupings: Summary, Key Facts, and Details. While most of the “Key Facts” are provided on the Browser page, the “Summary” and “Details” fields are only available on the System Profile page. The specific fields included in each field group are described in Table 5-1 and Table 5-2 and appear in that listed order if information is available. Unlike the Browser page where missing information is denoted by a blank cell, empty fields are not shown on the System Profile page.
- Section 8 provides information on the references for gathered system information. Where necessary and possible, references for specific fields are cited using the Reference ID at the end of the field text. Hyperlinks and a brief description are available for each reference.
Examples of How to Use it
Example Question 1
What kinds of effluent reductions have been achieved by wastewater reuse systems at multifamily residential buildings in cities with CSOs?
- Get a list of systems using the Browser with the following filters:
- Source: “Municipal Wastewater”
- Configuration: “Single Building – Multifamily”
- Drivers: “Combined Sewer Overflows”
- Scroll to the right until you get to the “Effluent Reduction (%)” column. Please note that this information may not be available for all systems on the list.
Example Question 2
Where in the US are condensate recovery systems being implemented and who can I contact for more information about the constructed systems?
- Get a list of systems using the Browser with the following filters:
- Source: "Condensate"
- The map will automatically update to show the locations of projects on the list.
- Use the System Profile page to look up information for individual systems. You can start typing in the name of the system in the System Name bar or select it from the dropdown. Scroll to the bottom of the Details section to see if anything is listed in the "Contacts" field.
Example Question 3
What types of water reuse projects are in a specific city (i.e., New York City)?
- Hover your mouse at the top right corner of the map on the Browser and select the "Focus mode" symbol. This will enlarge the map to the entire screen. Use your mouse to zoom in on New York City. Hover over the mapped projects to get their names, sources, end uses, and design capacities.
- Once you know the system names, you can look up additional summary information for them in the table. It will be easiest to find them if you sort the table by System Name (click on the column name) after narrowing the listed systems to the statewith the following filters:
- Country: "USA"
- State: "NY"
- You can also use the System Profile Search Tool to look up the individual systems. Find a system by typing it's name or selecting it from the dropdown in the System Name bar in the top left corner of the screen. When you start typing into the bar, it will narrow the dropdown list. You can also narrow the dropdown list for easier selection using the following filters:
- Country: "USA"
- State: "NY"